A very important part of investing is technical analysis, which tells you how the market is feeling and how prices might move in the future. There are many tools and signs used in technical analysis, but candlestick patterns are one of the most important ones.
One of these patterns is the spinning top candlestick, which may not look like much but can tell traders a lot. This piece will talk about the spinning top candlestick in technical analysis, including how it forms, what it means, and how it can help traders make decisions.
Getting to Know the Spinning Top Candlestick
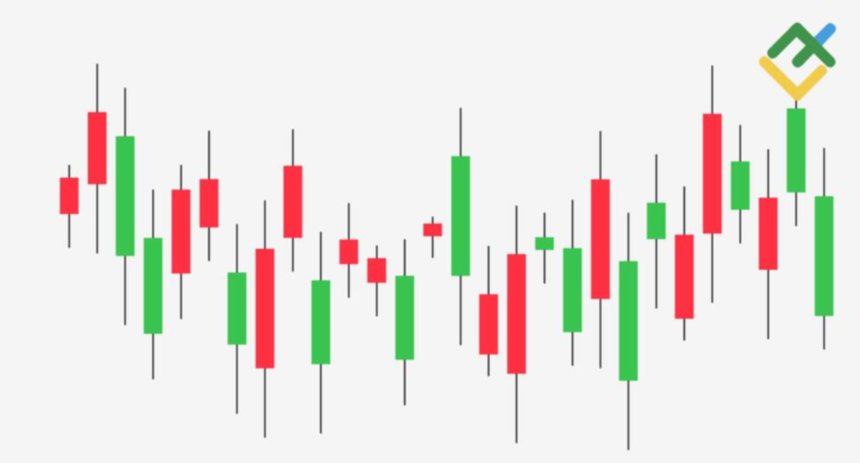
The body of a spinning top candlestick is small, and the upper and lower shadows are long. The small body shows that there wasn’t much change in price between the trading session’s beginning and ending prices. The long shadows, on the other hand, show that prices changed a lot during the session, going up and down a lot, but eventually closing close to where they started.
The most important things that make a candlestick a spinning top are:
- Little Body: This means that there isn’t much change between the opening and closing prices.
- Long Upper Shadow: This reflects the session’s highest point.
- Long Lower Shadow: When the session hits its lowest point, the long lower shadow shows it.
- Color: Can be optimistic (white or green) or bearish (black or red), but the shape of the pattern is more important than the color.
The market isn’t sure what to do, which is shown by the spinning top candle. Traders and buyers were both busy during the session, but neither could get ahead. As a result, the closing price was close to the opening price.
What the Spinning Top Candlestick Means
To understand the spinning top candlestick, you need to know what it’s used for. What this pattern means can change based on the current market trend and where it fits in that trend.
In an Uptrend: When a spinning top shows up during an upswing, it could mean that the trend is about to change or take a break. There is less bullish movement and buyers are not in full control, as shown by the pattern. Traders may want to think about taking gains or making stop-loss orders stricter if this happens.
In a Downtrend: A spinning top can show that the bearish momentum is weakening during a decline. It is no longer possible for sellers to get prices much lower, and the pressure to buy and sell is equal. This might mean that the trend is about to change or that there will be some stability before the next move.
At Support and Resistance Levels: A spinning top candlestick is more important when it shows up near important levels of support or resistance. A spinning top at a support level, for example, could mean that the support is staying and that a move to the upside is about to happen. A spinning top at a resistance level, on the other hand, could mean that the resistance is strong, which could lead to a move back down.
Technical Analysis with Spinning Top Candlestick
Based on past price changes and other numerical data, traders use technical analysis to make smart choices about what assets to buy and sell. Traders can use a number of different approaches to figure out what the spinning top candlestick pattern means and how to act on that information. The spinning top candlestick can be used in technical analysis in the following ways:
1. Signs that a trend is changing.
One of the main purposes of the spinning top candlestick is to show when a trend might change. If you see a spinning top after a long uptrend or decline, it means that the current trend may be losing steam and a change in direction is about to happen. To make the hint stronger, traders can look for confirmation from other indicators, like trendlines or moving averages.
3. Places to enter and leave.
The spinning top candlestick can help traders figure out when to enter and leave a trade. As an example, a spinning top near a key level of support or resistance could mean it’s time to make a deal going against the current trend. If, on the other hand, a spinning top appears after a big price change, it might be time to stop trading and take your gains.
3. Where to put the stop loss.
It is also possible to use the spinning top candlestick to find the right stop-loss levels. Traders can protect their money by putting their stop-loss orders below the low of a bullish spinning top (when the market is going up) or above the high of a bearish spinning top (when the market is going down).
4. Verification from the volume.
Volume is often a very important part of confirming the signs that spinning top candlesticks send. If the volume goes up while a spinning top is forming, it could mean that traders are very interested, which would make the indicator stronger. Low volume during a spinning top formation, on the other hand, could mean that the signal is weak and that the warning was set off by something else.
5. Analysis of more than one time frame.
Traders who use spinning top candlesticks can improve their study by adding more than one time frame. If a spinning top appears on a daily chart, for instance, traders can look at hourly or 15-minute plots to get a better idea of how the market is feeling and how prices might move.
In the End
The small body and long shadows of the spinning top candlestick make it an important tool in technical analysis because they show that the market isn’t sure what to do. Even though it might not give traders strong directional signs by itself, it can be useful when viewed in the context of current trends and important levels of support and resistance.
Traders can make better decisions and have a better chance of succeeding in the market by using spinning top analysis along with other technical indicators and tactics. Traders can add a new level of complexity to their basic analysis tools by learning how to use the spinning top candlestick correctly.