Flowchart: Definition
A flowchart is a graphical representation of a process, system, or computer algorithm. They are widely used in a variety of fields to document, examine, plan, enhance, and convey frequently complex processes in clear, simple diagrams.
Flowcharts, also known as flow charts, use rectangles, ovals, diamonds, and maybe other forms to indicate the type of step, as well as linking arrows to define flow and sequence.
They can range from simple hand-drawn charts to detailed computer-drawn diagrams displaying numerous processes and paths. Considering all of the different types of flowcharts, they are one of the most ubiquitous diagrams on the globe, used by both technical and non-technical people in a wide range of professions.
Steps to create a flowchart template:
Creating a flowchart can take time and effort so you always have the option to use ready-to-use flowchart PowerPoint templates. You can easily make edits according to your needs.
If you want to create the flowchart on your own here is how:
1) Define the process and determine the flow diagram’s scope.

2) Determine which project team members oversee the activities and must be included in the flow chart’s creation.
3) Define the many steps in the process as well as the interrelationships between them (all team members should help develop and agree on the different steps in the process)
4) Finalize the diagram, consulting other people as needed and making any necessary changes.
5) Use the flow diagram and keep it up to date as needed.
Benefit of flowcharts
Clarity of Vision
One of the most significant advantages of a flowchart is its capacity to depict many processes and their sequence in a single document. Stakeholders throughout an organisation can quickly understand the workflow and determine which steps are superfluous and which progress should be improved.
Communication in Real Time
Flowcharts can be used to replace meetings in teams. Simply clarifying progress provides a simple, visible manner for team members to grasp what they should do step by step.
Coordination that works
A flowchart provides project managers and resource schedulers with the flexibility to sequence events and limit the risk of overburdening team members. By eliminating needless tasks, you can save time and money.
Improved Efficiency
Flowcharts have a big impact on efficiency. Each step required to complete a process is listed in the flowchart. The flowchart assists a designer in removing unnecessary stages and errors from a process. The flowchart should only include the stages that are required to complete the procedure.
Analytical Effectiveness
The problem can be more effectively analysed with the use of a flowchart. It specifies the sort of action required for each phase in a process. In general, a rectangle with rounded corners represents the start or conclusion of the process, a diamond shape represents the point at which a decision must be made, and a square block represents an action taken within the process.
Problem-Solving
Flowcharts divide an issue into easily identifiable sections. The flowchart depicts the way of solving a difficult problem by defining the procedure. A flowchart lowers the likelihood that an essential step in issue solving will be overlooked because it appears clear. In this manner, it saves money and time.
Documentation
Digital flowcharts serve as useful paperless documentation for a variety of applications, making things more efficient.
Application of flowcharts in business
Sometimes presenting something visually is more effective and easier than presenting it verbally. That is what flowcharts do for us when we use them in Business Architecture. Flowcharts may illustrate highly complicated business processes using symbols and language that are much easier for a wider audience to understand and absorb fast. Here are some of the most compelling reasons to employ flowcharts:
- Represent an employee’s everyday responsibilities or routine.
- Recognize the paths that customers follow on a website or in a store.
- Create a business plan or a plan for product realisation.
- Document a process in advance of an audit, including regulatory compliance, such as the Sarbanes-Oxley Act.
- In preparation for a sale or consolidation, document a process.
- Recognize the order and procurement processes.
Elemenst in a flowcharts:
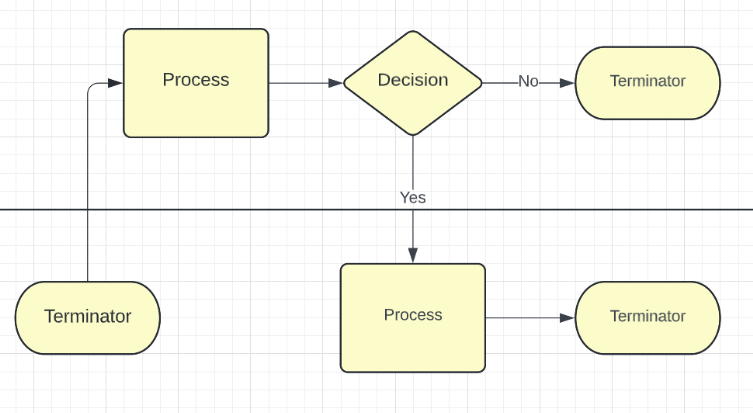
Flowcharts often employ specific symbols to represent each stage of the process. Among the most common symbols used to create flow charts are:
1) A round-edged rectangle to represent starting and ending activities, also known as terminal activities.
2. A rectangle to symbolise a transitional activity or stage. A single rectangle, known as an activity or process symbol, represents each step or activity inside a process.
4. A diamond can be used to depict a decision point. Inside the diamond, which is known as a decision sign, is written the question to be answered or the decision to be taken. The response (usually Yes or No) dictates the next course of action.
4. Flow lines depict the flow of one step to the next.
5. Swin lane is used to visually differentiate the jobs or responsibilities performed by various people or departments.
Conclusion
Flowcharts are an important tool in the hands of business architects and an integral aspect of a business process management methodology. Creating proper flowcharts can be time-consuming, but the benefits they can provide in the short and long run make them worthwhile. Flowchart is an amazing tool to present data. Make sure your data is suitable for a flowchart and if so select the right timeline. Ensure to have all the right components added in your flowchart so that the data is conveyed with clarity and precision. If flowchart is not the right choice for your data then there are various other options like timeline diagrams, fishbone infographics, and mind map.