Using data visualization and analysis tools is essential at a time when environmental, social, and governance (ESG) aspects are becoming more and more important for firms to monitor and report on.
Fortunately for us, the UN has considered exposing databases and pushing such an approach to other organizations with the SDGs. By giving important information on natural resources, government operations, public services, and population demographics, open data can assist accomplish the SDGs. These findings can help shape national goals and establish the most effective ways to address national concerns. It may also assist in efficiently connecting your ESG goals with the most pressing concerns in a certain region’s population and measuring progress at a larger level than simply your firm.
A notable tool that has been more popular in the last several years is Microsoft Power BI. With the use of Power BI, a business analytics solution, enterprises may share insights from data visualization inside the organization or incorporate them into an application or website.
Eco-Friendly Reporting’s Ascent
Before getting into the details of how Power BI may help with ESG reporting, it’s important to comprehend how ESG is becoming more and more important in the business sector.

Using data-driven insights provided by Microsoft Power BI, improve and alter the way sustainable energy is managed, and produce value across energy generation, supply, distribution, and consumption.
Investors, customers, and other stakeholders assess a company’s governance processes, social and environmental effect, and other aspects via ESG reporting.
ESG reporting includes supply chain ethics, diversity on boards, diversity and inclusion, and carbon emissions.
Consumers are choosing businesses that exhibit a commitment to sustainability and social responsibility. Whereas, investors are taking environmental, social, and governance (ESG) seriously when deciding for the investment.
Data Visualization Makes Things Seamless
Power BI’s strength in data visualization lies at the core of its capabilities.
Microsoft is developing a collection of reporting templates that are aligned with ESG data models to assist you in producing insights and optimized ESG reports. These reporting templates let you show relevant information in Power BI and speed up the study and reporting of ESG categories.
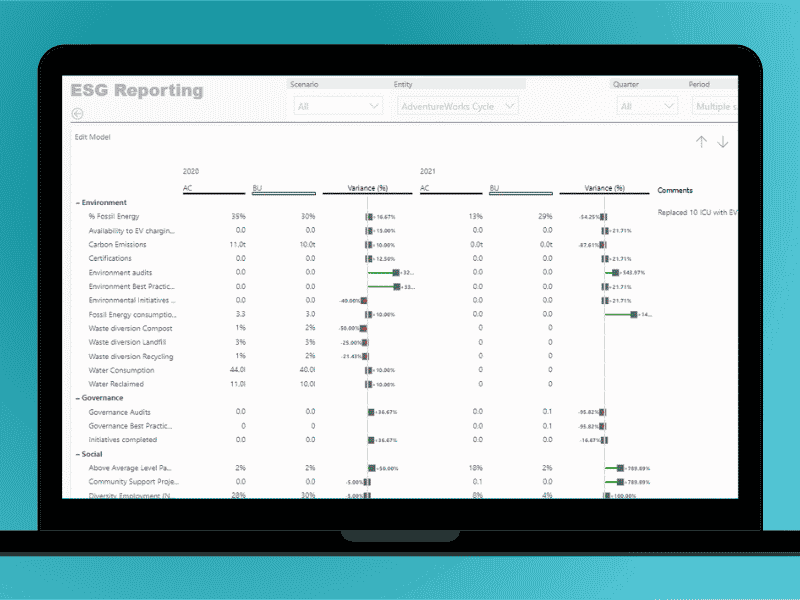
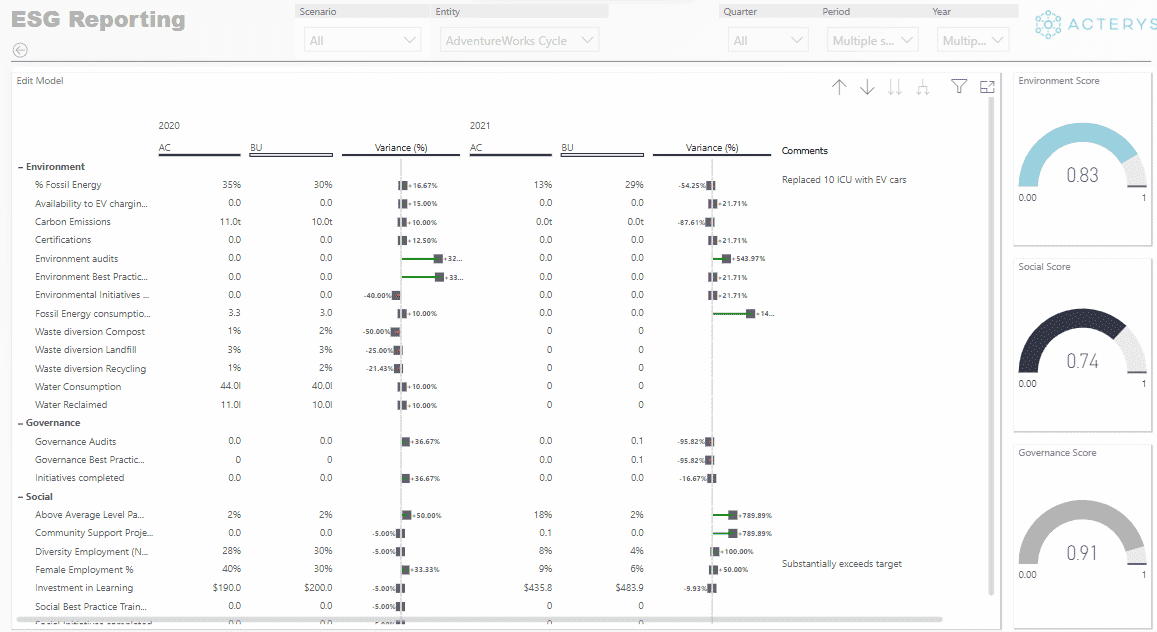
With Power BI, users can generate aesthetically attractive and interactive reports and ESG dashboard Power BI, which streamlines the process.
Feature details
Enable out-of-the-box reporting templates to gain insight into how your firm performs in terms of environmental, social, and governance (ESG) concerns. Prepare for internal and external reporting obligations by using Power BI reports and visualizations to share ESG data and goals. Customize these reports to expedite ESG category analysis and reporting.
Personalization and Narration
Power BI’s ability to be customized is one of its best qualities. Microsoft Sustainability Manager is a sophisticated solution that automates laborious operations and allows for the collection of sustainable data. It also provides reports, helps to reduce environmental effects and emissions, improves operational efficiency, and builds more sustainable value chains. It enables the creation of KPIs and objectives for tracking progress. This might be expanded by employing Microsoft technologies such as Azure and Power Platform. It is worth noting that the trial edition is available for free for one month.
The Sustainability Manager solution is supplemented by the Emission Impact Dashboard – Microsoft Sustainability Calculator. It is a Microsoft Cloud-based carbon monitoring tool accessible on Azure and Microsoft 365 that measures emissions and potential carbon savings using Power BI template applications. Power BI provides you the tools to communicate a compelling tale to your audience, whether you want to openly address concerns or highlight specific triumphs. The technique was developed to include emissions from all three scopes of effect, and – more importantly – carbon accounting was confirmed by Stanford University scientists in 2018.
What report you can customize
This feature is ideal for report writers: You can allow basic exploring situations for your report readers. Ad hoc study of visuals on a Power BI report delivers additional information to your report viewers. They have the following options:
- Change the visualization type.
- Add or remove a legend.
- Swap out a measure or dimension.
- Compare two or more measures.
- Change aggregations, etc.
This feature not only allows for additional exploring possibilities, but it also enables methods for users to capture and share their changes:
- Capture their changes.
- Clear out their recent changes.
- Reset all of their report changes. Reset to default removes all customization.
- Share their changes.
- Reset all their changes for a visual.
Integration of Data and Networking
Many times, companies must gather data from many sources in order to report on ESG performance in an efficient manner.
Without the requirement for an on-premises data gateway, virtual network data gateways enable the import or direct query of datasets to connect to data services within an Azure VNet.
Virtual network data gateways is a Premium and Embedded feature that will be available for public preview exclusively in Power BI Premium workspaces, Premium Per User (PPU), and Power BI embedded analytics. However, as VNet data gateways become widely available, license requirements may alter. This information may be dispersed over many departments, platforms, and file types.
Real-Time Data Updates
ESG reporting needs constant monitoring and updating; it is not a one-time job. Because Power BI has real-time data refresh capabilities, your ESG reports will always be current.
Power BI with real-time streaming helps you stream data and update dashboards in real time. Any visual or dashboard created in Power BI can display and update real-time data and visuals. The devices and sources of streaming data can be factory sensors, social media sources, service usage metrics, or many other time-sensitive data collectors or transmitters.
This is how companies can show their ESG performance in real time.
Calculating ROI and Impact
Automating data analysis processes and converting data into useful and valuable insights is of course beneficial (better, faster decisions based on actual data not just gut feeling). But accurate estimations can quickly become tricky.
Let us attempt to simplify it by performing some ROI (return on investment) calculations. In the case of BI, it may be separated into three broad categories:
- Cost of installing and maintaining a BI system (development, servicing, and licensing)
- Direct advantages of BI solutions (less time spent developing and delivering reports, fewer data inaccuracies, less manual labor, and so on)
- Indirect advantages of BI solutions.