Mastering technical analysis can be the key to consistent profits. Among the many tools traders rely on, bullish divergence stands out as a powerful signal for spotting potential trend reversals. However, identifying it correctly requires a deep understanding of price action, momentum indicators, and market psychology.
In this article, we’ll break down how to identify bullish divergence like a pro, share real-life trading experiences, and highlight common mistakes to avoid. Whether you’re a beginner or an experienced trader, these insights will help you harness the power of bullish divergence with greater confidence.
Key Takeaways
- Bullish divergence occurs when price makes lower lows, but indicators make higher lows.
- It’s a strong signal but not infallible—confirmation and risk management are essential.
- Avoid common pitfalls like over-reliance on divergence, misidentification, and poor risk management.
- Continuous learning and real-world experience are crucial for mastering this strategy.
Understanding Bullish Divergence
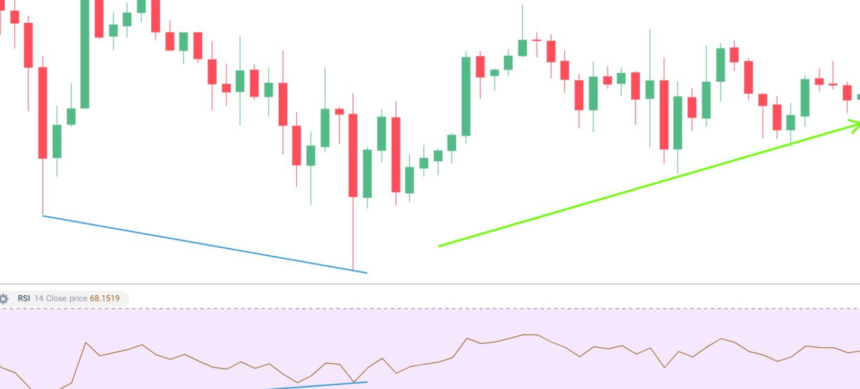
Bullish divergence occurs when the price of an asset forms lower lows, but an associated technical indicator, such as the Relative Strength Index (RSI) or Moving Average Convergence Divergence (MACD), forms higher lows. This discrepancy suggests that while prices are falling, the downward momentum is weakening, signaling a potential reversal to the upside.
Key Characteristics of Bullish Divergence:
- Price Action: Lower lows on the price chart.
- Indicator Behavior: Higher lows on the technical indicator.
- Reversal Potential: Indicates weakening bearish momentum, hinting at a bullish reversal.
Understanding this pattern is crucial because it helps traders enter trades early in a new uptrend, maximizing profit potential while minimizing risk.

How to Identify Bullish Divergence Like a Pro
1. Choose the Right Technical Indicators
While several indicators can highlight bullish divergence, the most effective ones include:
- Relative Strength Index (RSI): Measures the speed and change of price movements.
- MACD (Moving Average Convergence Divergence): Identifies changes in the strength, direction, and momentum of a trend.
- Stochastic Oscillator: Compares a particular closing price of a security to a range of its prices over a certain period.
2. Compare Price Lows with Indicator Lows
- Step 1: Identify two or more consecutive lower lows on the price chart.
- Step 2: Check the corresponding lows on your chosen indicator.
- Step 3: If the indicator shows higher lows while the price makes lower lows, you’ve spotted bullish divergence.
3. Confirm with Additional Signals
To increase the accuracy of your analysis:
- Look for volume spikes, which can confirm a reversal.
- Identify candlestick patterns like bullish engulfing or hammer patterns.
- Use trendlines and support levels to strengthen your setup.
4. Analyze Multiple Timeframes
Professional traders often analyze multiple timeframes to confirm divergence signals. A bullish divergence on a higher timeframe (like the daily chart) holds more weight than one on a lower timeframe (like the 5-minute chart).
Real-Life Trading Experience: A Lesson Learned
During my early trading days, I spotted what appeared to be a textbook bullish divergence on the EUR/USD pair. The price formed lower lows, while the RSI showed higher lows. Convinced I had found a perfect setup, I entered the trade without further confirmation.
Initially, the price moved slightly in my favor, but soon after, it reversed sharply against me, hitting my stop loss. Reflecting on the trade, I realized I had overlooked key confirmation signals like volume analysis and higher timeframe trends.
This experience taught me that identifying bullish divergence is just the first step. The real skill lies in validating the signal with additional technical and fundamental factors, a concept thoroughly explored in the Elliott Wave Course.
Common Mistakes to Avoid When Identifying Bullish Divergence
1. Relying Solely on Bullish Divergence
While bullish divergence is a strong signal, relying on it alone can lead to false entries. Always use it in conjunction with other indicators and analysis techniques.
2. Misinterpreting Regular Price Fluctuations
Not every higher low on an indicator qualifies as bullish divergence. Ensure the price is forming clear lower lows, and the indicator shows distinct higher lows.
3. Ignoring the Overall Market Trend
Attempting to trade bullish divergence in a strong downtrend can be risky. Always consider the broader market context before entering a trade.
4. Overlooking Confirmation Signals
Skipping confirmation signals like volume analysis, candlestick patterns, and trendline breaks can result in premature entries.
5. Neglecting Risk Management
Even with a strong bullish divergence setup, trades can fail. Always set stop-loss orders and manage your position size to protect your capital.
Simple Calculation Example
Let’s consider an example using the RSI:
- Price Action: Lower lows at $50 and $45.
- RSI Indicator: Higher lows at 30 and 35.
This discrepancy between price and RSI signals bullish divergence, suggesting a potential upward price movement. Always validate this with additional indicators or volume analysis.
Conclusion
Identifying bullish divergence like a pro requires more than just spotting discrepancies between price and indicators. It demands a comprehensive approach, including confirmation signals, multi-timeframe analysis, and disciplined risk management, as practiced by expert traders at Alchemy Markets.
By avoiding common mistakes, seeking confirmation, and continuously refining your skills, you can harness the power of bullish divergence to enhance your trading performance. Remember, trading success isn’t about perfection; it’s about consistent, informed decision-making based on solid analysis.
Frequently Asked Questions (FAQs)
1. What Is the Best Indicator for Spotting Bullish Divergence?
RSI and MACD are the most popular indicators. However, the best choice depends on your trading style and the asset you’re analyzing.
2. Can Bullish Divergence Occur in All Markets?
Yes, bullish divergence can be identified in forex, stocks, cryptocurrencies, commodities, and even indices. The underlying principles remain consistent across markets.
3. Is Bullish Divergence a Guaranteed Signal for Reversal?
No. While it indicates a potential reversal, it’s not foolproof. Always use additional confirmation signals and risk management strategies.
4. How Can I Improve My Accuracy When Trading Bullish Divergence?
- Use multiple indicators for confirmation.
- Analyze different timeframes.
- Combine divergence with price action and volume analysis.
5. What Timeframe Works Best for Bullish Divergence?
The ideal timeframe depends on your trading strategy. Day traders may prefer shorter timeframes (5-15 minutes), while swing traders focus on longer ones (4-hour or daily charts).